Overview
Overview summarizes the selected profile, runtime context, diagnostics, recent activity, and profile logs.
How data appears
Section titled “How data appears”ColimaStack loads profile data with colima list --json and selected-profile status with colima status --json. Docker and Kubernetes details appear only after a selected profile is running and the relevant CLIs are available.
What the view shows
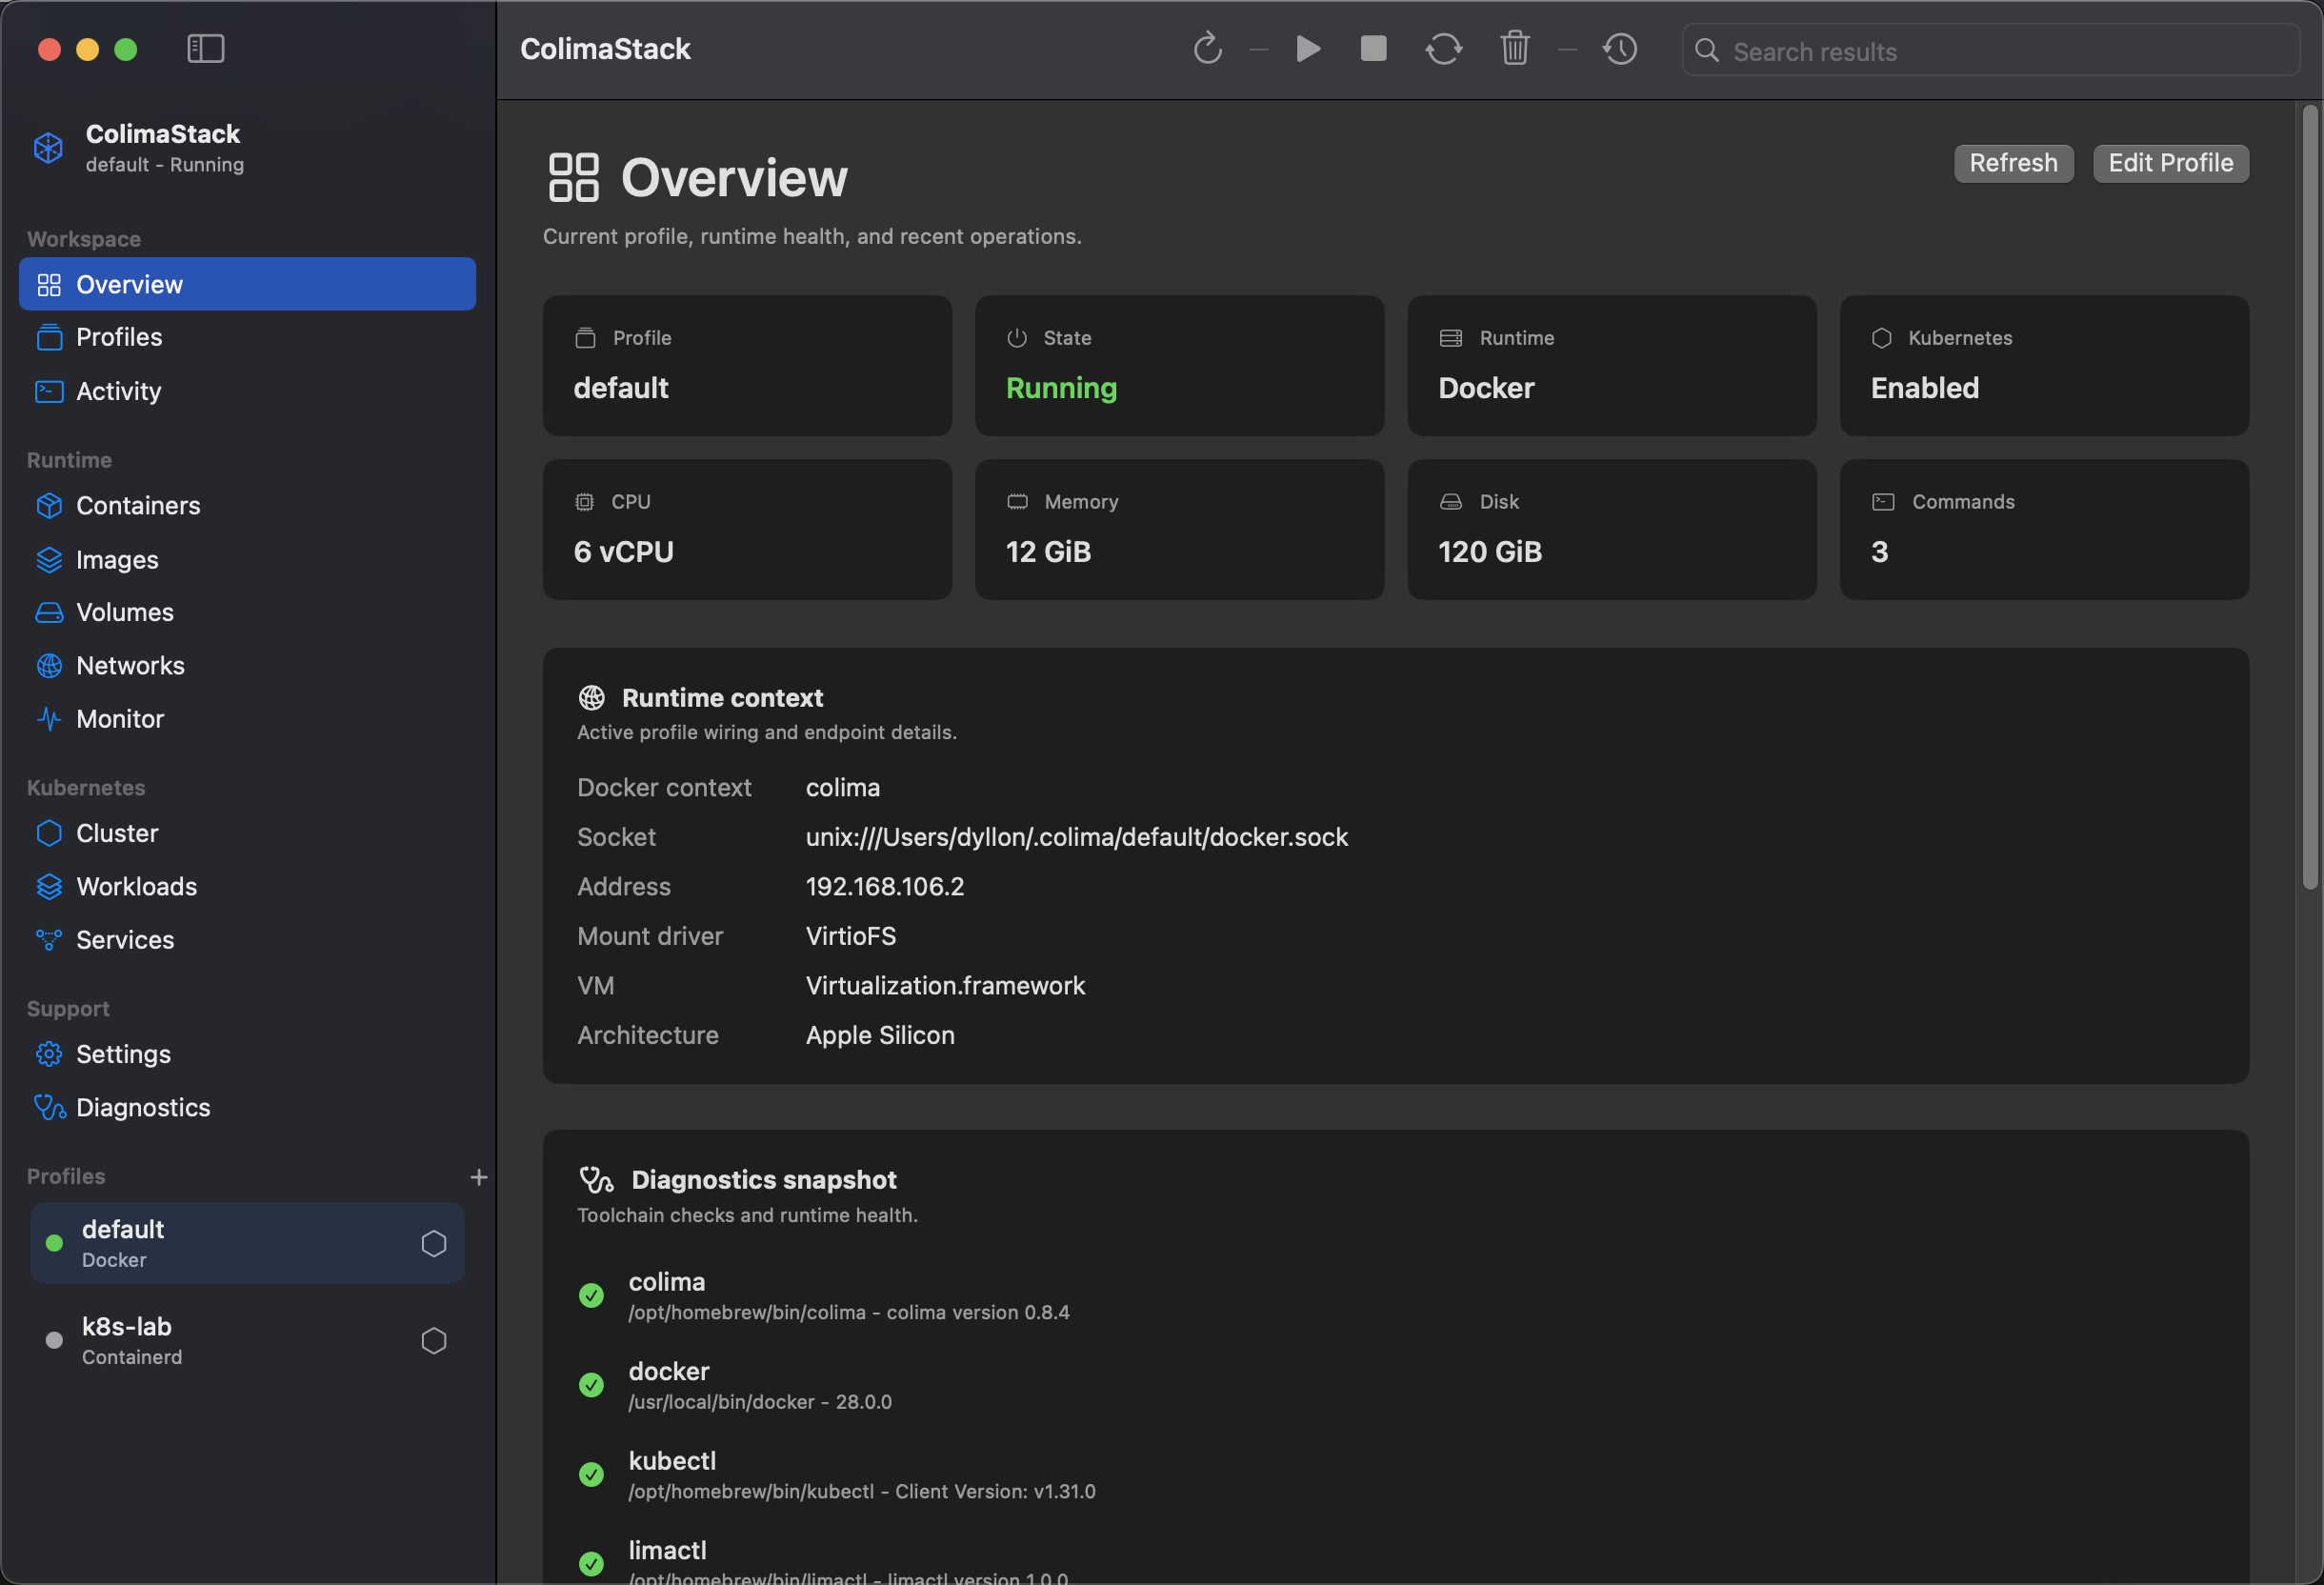
Section titled “What the view shows”- Profile name and state.
- Runtime and Kubernetes enabled/disabled state.
- CPU, memory, and disk allocation from profile status/configuration.
- Docker context, socket, VM address, mount driver, VM type, and architecture.
- Tool checks from Diagnostics.
- Recent lifecycle commands.
- Selected profile log text from the Colima daemon log path.
Available actions
Section titled “Available actions”RefreshEdit Profile- Sidebar profile selection
- Navigation to Docker, Kubernetes, Activity, and Diagnostics views
Lifecycle actions (Start, Stop, Restart, Delete) are in the main toolbar, menu bar, and Profiles view.
Empty states
Section titled “Empty states”Loading Colima environment: startup diagnostics and profile discovery are still running.Colima dependency required:colimais not available in the tool lookup path.No profiles configured: Colima is installed but no profiles were returned.- Runtime warnings:
colima status --jsonreturned warnings or errors for the selected profile.
Common fixes
Section titled “Common fixes”- Install missing tools from Install.
- Start the selected profile from Profiles.
- Use Diagnostics when Docker or Kubernetes data is unavailable.
- Check exact commands in Command API.