Activity and Logs
Activity shows app-initiated lifecycle operations and the selected profile’s Colima daemon log.
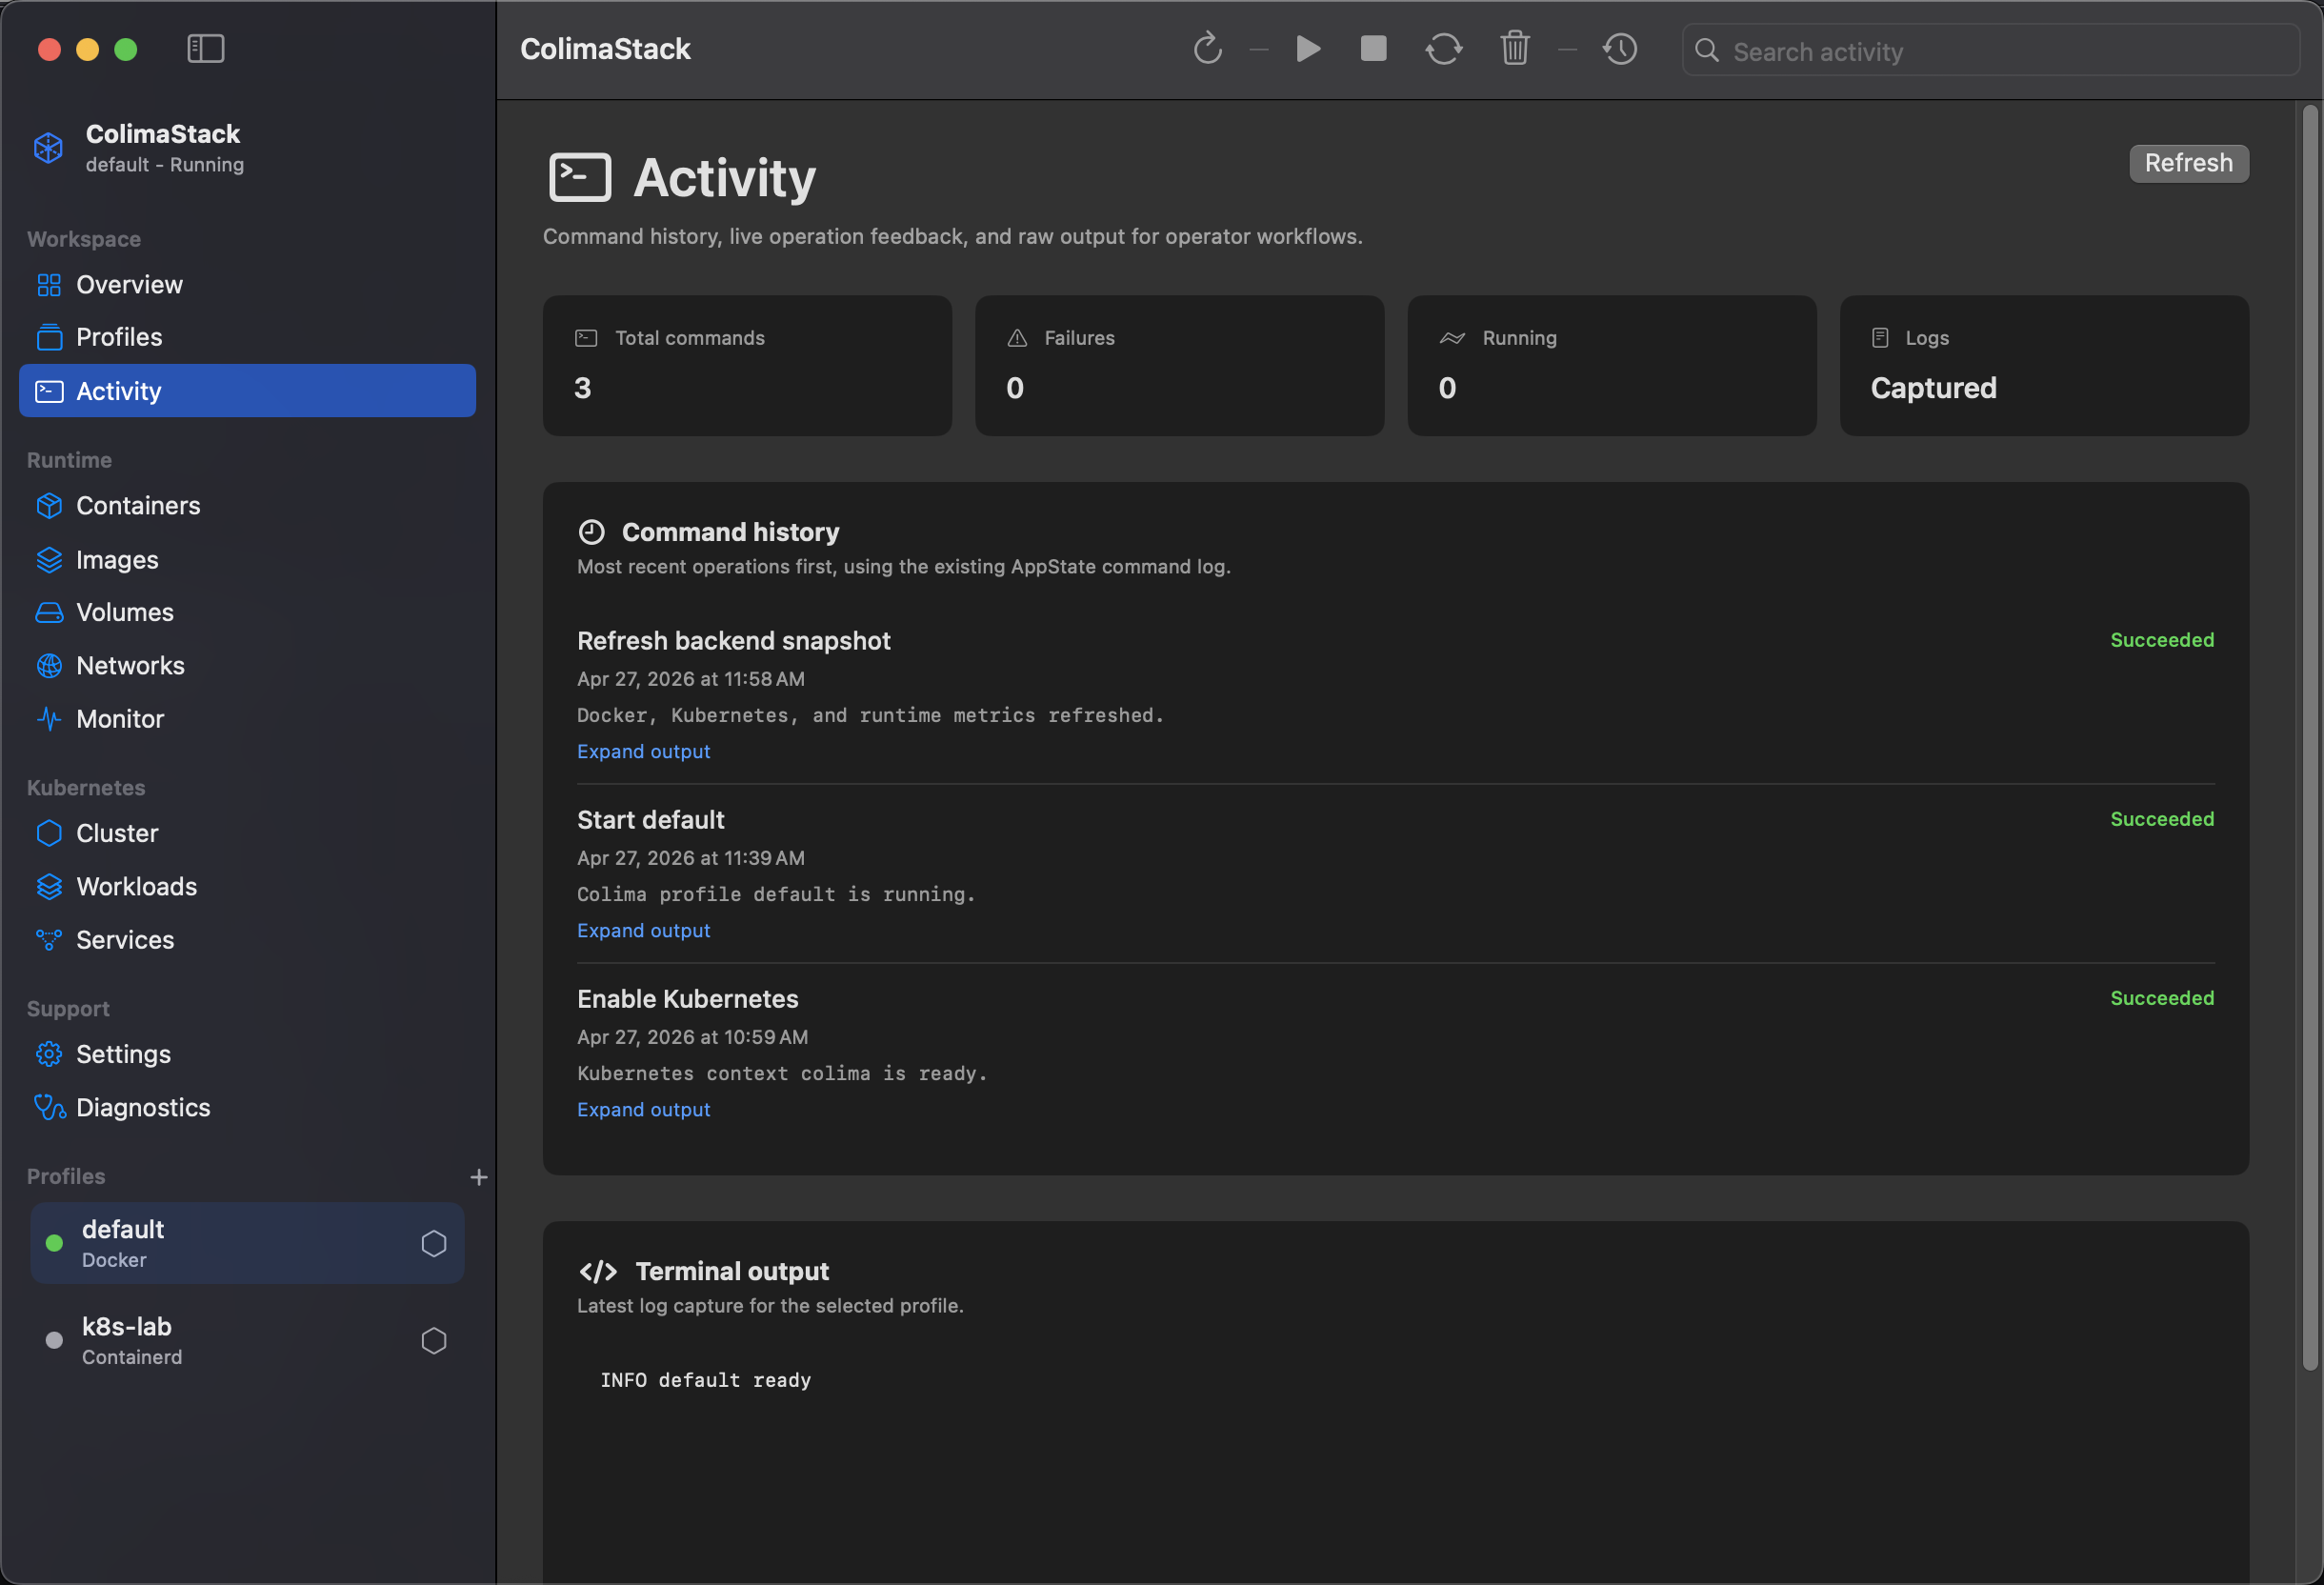
What this view shows
Section titled “What this view shows”Command runningbanner while a mutating operation is active.Total commands,Failures,Running, andLogstiles.- Command history, newest first.
- Command status: running, succeeded, or failed.
- Captured command output with
Expand output/Collapse output. Terminal outputfrom the selected profile log.
Log sources
Section titled “Log sources”Command history comes from app-initiated operations such as Start, Stop, Restart, Delete, Update Profile, Create, Apply, and Kubernetes toggle actions.
Profile logs are read from:
$COLIMA_HOME/<profile>/daemon/daemon.logor ~/.colima/<profile>/daemon/daemon.log when COLIMA_HOME is not set.
Docker and Kubernetes read-only inventory commands are collected as backend command runs for issues/search, but the visible Activity command history is the app-level command log.
Caps and truncation
Section titled “Caps and truncation”- Command history is capped at 200 entries.
- Displayed profile logs are capped to the last 200,000 characters.
- Process stdout and stderr are capped at 1,048,576 bytes per stream and marked when truncated.
Refresh behavior
Section titled “Refresh behavior”Click Refresh or leave Auto Refresh enabled. Auto-refresh runs every Normal 10 seconds by default and skips while a command is active or the profile editor is open.
Empty states
Section titled “Empty states”No command history yet: no app lifecycle operations have run in this session.No matching activity: local search filtered the command history.- Missing profile log: the terminal output area shows the missing daemon log path.
Common fixes
Section titled “Common fixes”- Use Profiles to run a lifecycle action and populate command history.
- Use Diagnostics when commands fail.
- See Security & Privacy for redaction and storage limits.