Monitor
Monitor is in the app sidebar under Runtime. It shows live usage and capacity for the selected running Colima profile.
How data appears
Section titled “How data appears”Monitor samples are collected when a selected Docker profile is running and backend inventory refresh succeeds. Samples are added by manual Refresh and by Auto Refresh.
Auto-refresh frequencies are:
Faster: 2 secondsFast: 5 secondsNormal: 10 seconds
The refresh loop skips while a command is active or the profile editor is open. Monitor history is capped at 90 samples per profile.
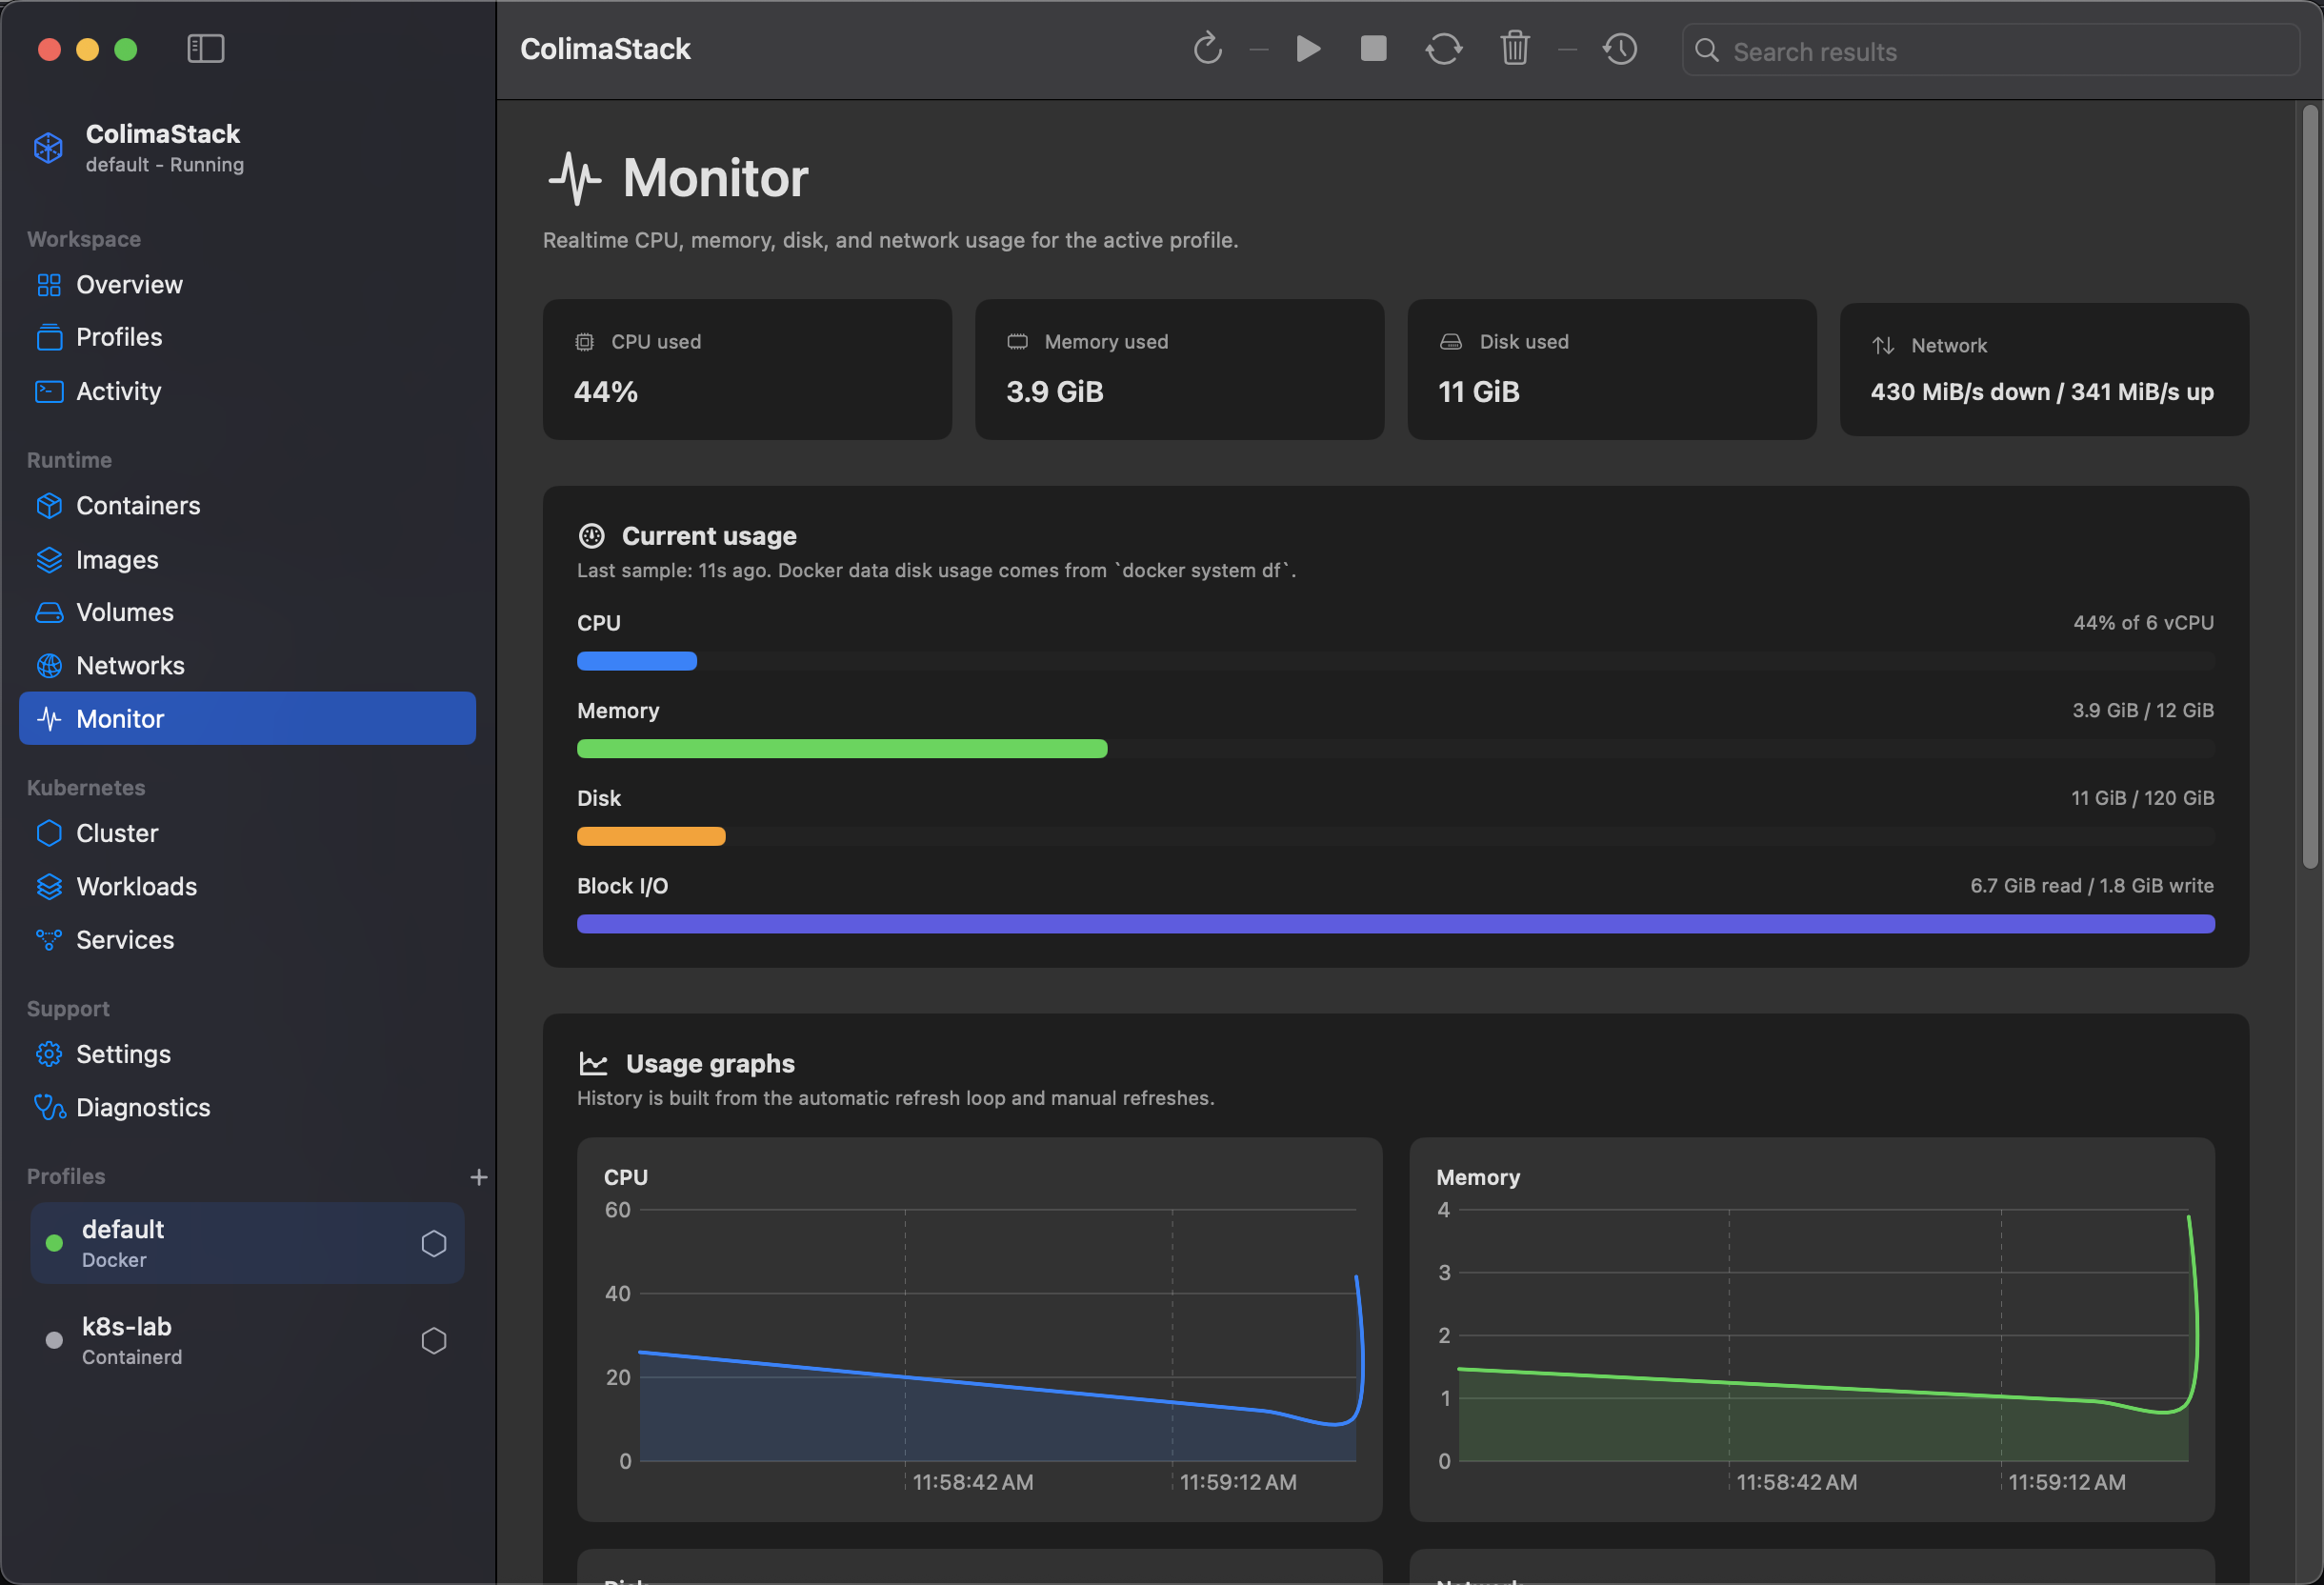
Metrics shown
Section titled “Metrics shown”CPU used: sum of Dockerstats --no-streamCPU percentages.Memory used: sum of Docker stats memory usage.Disk used: sum of Dockersystem dfsizes.Network: total I/O for the first sample, then receive/transmit rate between samples.Block I/O: read/write totals from Docker stats.Capacity allocations: configured CPU, memory, and disk ceilings for the selected profile.Health signals: running container count, number of running Colima profiles, command failures, Docker availability, and Kubernetes enabled/disabled state.
CPU is shown as usage against configured vCPU capacity. Memory and disk progress use configured profile allocation when available. Kubernetes metrics are collected for Kubernetes pages and backend metrics, but the Monitor usage sample is based on Docker stats and Docker disk usage.
Empty states
Section titled “Empty states”Monitor unavailable: diagnostics have not found a usable Colima setup.No profile selected: choose a profile first.Live usage unavailable: no runtime sample has been collected for the selected running profile.No usage history yet: wait for auto-refresh or clickRefresh.
Common reasons data is unavailable
Section titled “Common reasons data is unavailable”- Selected profile is stopped.
- Selected profile is not a Docker runtime.
- Docker CLI is missing or cannot reach the selected context.
- Colima profile status has no Docker context/socket yet.
- Docker stats or disk usage commands fail.
- Tool lookup or
PATHdoes not include the required CLI.
Use Overview to confirm the selected context, and Diagnostics to inspect missing tools and runtime errors.